What are customer retention metrics?
Customer retention metrics are measurable values (like percentages, ratios, or revenue figures) that customer success, product, and revenue teams track to evaluate how well they retain existing customers over a specific time period.
These metrics are typically included in retention or revenue reports, often presented as dashboards, charts, or tables, on a monthly, quarterly, or annual basis, depending on the company's billing cycles and customer engagement patterns.
6 customer retention metrics to track
Note that this isn't an all-inclusive list. Depending on your business model, customer base, and goals, your metrics and naming conventions may vary. Still, these metrics represent the core building blocks for understanding and improving retention across any SaaS business.
1. Customer Retention Rate
The most fundamental customer retention metric is the customer retention rate (CRR). It tells you what percentage of your existing customers stay with you during a specific timeframe, which in turn helps you understand if your current tactics are working in keeping them engaged.
If your retention rate is high, it means most of your customers find enough value to stay. If CRR shows a downward trend, it's a clear warning that something in the customer journey, perhaps product experience, support, or pricing, is causing customers to leave.
Here's how you can calculate it:

Retention rates typically improve as SaaS companies grow. Take a look at this data:
- Early-stage startups with less than $1 million ARR often see a wide range of retention rates due to varying levels of product-market fit.
- As companies scale to $3–8 million ARR, top performers retain around 80% of their customers.
- Larger companies in the $15–30 million ARR range improve further, with retention rates around 84%.
Across all ARR levels, leading SaaS companies maintain customer retention rates between 85% and 87% annually.
💡 Related guide: How to Drive Better Customer Retention in B2B SaaS
2. Customer Churn Rate
The inverse of the customer retention rate is churn, and it measures the number of customer accounts lost during a given time frame.
While churn was once considered to be the go-to north star metric for SaaS, over the years, the industry has grown to recognize it's not enough on its own. Instead, it works best when paired with other key metrics to help you understand why customers are leaving and what you can do to reduce that loss.
Despite this shift, the churn rate remains a vital data point for SaaS. Here's how you can calculate it:

When calculating the churn rate, keep in mind not to include new customers acquired during that time or those on free trials or free plans. The goal here is to understand how well you're holding onto the paying customers you already have.
While a certain level of churn is natural, when churn is consistently high, it's often a red flag that something isn't working in your product, service, pricing, or customer experience.
According to ChartMugol, the median monthly churn for SaaS companies with less than $300K in ARR sits around 6.5%, which is relatively high.
💡 Related guide: The Ultimate Guide to Reducing Customer Churn in SaaS
3. Net Revenue Retention
Net Revenue Retention (NRR) is an extremely popular metric businesses use to understand customer retention. It measures how much revenue you retain from your existing customer base after accounting for lost income due to churn or downgrades and adding revenue from upsells or cross-sells.
Here's how you can calculate it:

An NRR over 100% means your existing customers are generating more revenue over time, even if you lose a few. Less than 100%? That's a sign you're losing more revenue than you're gaining.
NRR can be measured over any period, but it's most commonly tracked annually. Measuring over 12 months captures the full customer lifecycle, including adoption and expansion, and helps smooth out seasonal fluctuations. If you'd like to track shorter intervals, make sure to look at the same intervals consistently.
Net revenue retention tends to strengthen as SaaS companies grow and deepen customer relationships. Here's a breakdown of typical NRR benchmarks by ARR:
- Early-stage startups with less than $1 million ARR often start with lower NRR, with top performers being around 79%
- Companies growing to $1–3 million ARR typically improve to about 94%.
- Mature SaaS businesses in the $15–30 million ARR range often exceed 105%, meaning they're expanding revenue within their existing customer base.
4. Gross Revenue Retention (GRR)
Gross Revenue Retention (GRR), sometimes called gross dollar retention, measures the percentage of recurring revenue you keep from existing customers over a set period, excluding any revenue gained from expansions.
Here's how you can calculate it:

If your GRR is below 100%, it means that lost revenue due to churn or downgrades is greater than the revenue you kept from renewals. A drop in GRR signals is a clear indication that retained accounts may be reducing their spend—highlighting the need for targeted engagement or adjusting your product offerings.
Here's what good GRR looks like for SaaS companies:
- Top SaaS businesses usually keep their GRR above 86%, meaning they lose less than 14% of their revenue from existing customers each year.
- However, this benchmark can vary based on factors like Average Revenue Per Account (ARPA). For instance, companies with an ARPA above $500/month often achieve over 90% GRR, while those with an ARPA below $50/month may see GRR between 60% and 70%.
5. User Retention Rate
User Retention Rate measures the percentage of individual users within your customer accounts who keep using a product over a specific time period.
Here's how you can calculate it:

Even though this is a "user-level" metric, it's a powerful early warning sign for potential account churn. If individual users stop logging in or churn, the risk of the entire account canceling increases tremendously.
Regularly monitoring your user retention (e.g., the percentage of users still active after 30 days) helps your team spot declining engagement early. This gives you the chance to step in with personalized support, training, or strategic check-ins.
6. Revenue Churn Rate
Unlike customer churn rate, which just counts the number of accounts lost, revenue churn looks at the actual dollar value of lost accounts, making it especially important for understanding the real financial impact of churn.
For example, if revenue churn is high, your retention teams know to rescue higher-value accounts first (e.g., enterprise contracts) because losing them has a bigger effect on cash flow and forecasting.
There are two ways to calculate it, depending on how much detail you want:
- Gross revenue churn rate: It measures the percentage of revenue lost from existing customers through cancellations or downgrades without factoring in expansion.
- Net revenue churn rate: This shows the overall revenue loss after accounting for churn, downgrades, expansions, and reactivations.
Revenue churn tends to be higher in the early stages of a SaaS company and decreases as the business matures and better aligns with its target customers. Here’s what good revenue churn looks like for SaaS companies:
- Early-stage SaaS companies (under $1M ARR) often see gross churn around 9.1% and net churn around 6.2%.
- As companies grow into the $1M–$15M ARR range, those numbers improve. Gross churn typically drops to about 5.3%, and net churn to around 2.3%.
- The best-performing SaaS companies often achieve net revenue churn below 0%, meaning their expansion revenue fully offsets churn.
Best practices for tracking customer retention metrics accurately
To get meaningful insights from your retention data, it's essential to follow consistent and scalable tracking methods. Here are a few proven best practices to make sure your customer retention metrics are both reliable and actionable:
Define consistent timeframes
Set a standardized reporting interval, like monthly, quarterly, or annually, based on how your customers interact with your product and how you bill them.
For example, if you bill your customers every month, then tracking retention monthly is the way to go. If you mostly sell yearly contracts, then annual retention data will be more useful.
Using consistent timeframes helps you compare results over time, spot patterns (like seasonal dips), and make sure everyone on your team is looking at the same numbers.
Manually tracking churn and retention gets messy fast, especially as your customer base grows.
Instead, use tools like a CRM like HubSpot or Salesforce, billing platforms like Stripe or Chargebee, or analytics tools like Gainisght that can analyze your retention data.
These tools automatically gather customer activity data, run retention calculations, and provide customizable dashboards, which allow you to visualize retention metrics efficiently and respond promptly to changes.
Maintain clean and up-to-date data
Your metrics are only as trustworthy as the data behind them. Make it a regular practice to clean your customer records by removing duplicates, updating inactive accounts, and verifying subscription statuses.
Accurate data ensures your numbers reflect reality, giving you better visibility into what's working and where you're at risk of churn.
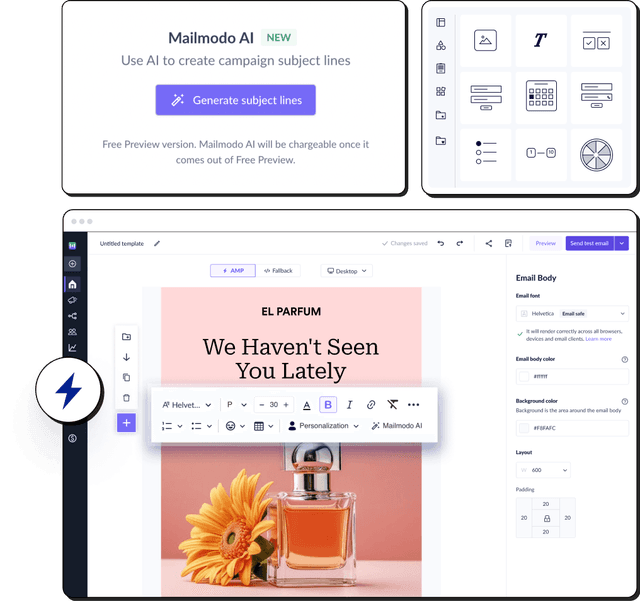
Boost customer retention with interactive emails
Final thoughts
The high-level retention metrics covered in this guide give you a foundational understanding of customer health and business sustainability.
Start making sure your team has complete visibility into the metrics and knows how to respond when trends shift. Over time, you'll notice patterns in customer behavior, uncover areas for improvement, and develop more targeted tactics that reduce churn and strengthen long-term loyalty.