- Platform

- Resources
Learn Marketing

Guides

Email Templates

Email Flows

Ebooks & Reports

Marketing Videos

Newsletter
See More Resources ->
Free Tools
Email Marketing 101 FREE
Read Now ->

15 Best Data Visualization Software
Are you looking for a Data Visualization Software for your business? You have come to the right page. This guide will help you discover the best Data Visualization Software and along with a deep dive into their features, pricing, rating, etc.

What is Data Visualization Software?
Data visualization software is a tool that helps users to analyze and present data in a visual format. It allows users to create dynamic and interactive charts, graphs, and maps that help to identify trends, patterns and relationships in data. This software has the ability to process large amounts of data from various sources and turn it into a visual representation that is easy to understand. It is a powerful tool for businesses, nonprofits, and governments that need to communicate complex data to a wide range of audiences. Data visualization software allows users to make informed decisions by presenting data in a way that is easily digestible and compelling.
How Data Visualization Software work or function?
Data visualization software is a tool that allows users to create graphical representations of complex data sets. These visualizations help in exploring and analyzing large amounts of data in a simplified way, making it easier to identify patterns and trends. The software typically includes various tools for designing and customizing visualizations, which enables users to create compelling and informative data stories. The software also allows for real-time updates and interactive features, making it easier to share insights and collaborate with others.
Benefits of Data Visualization Software?
- Data visualization software enables users to transform complex data sets into visual representations that are easy to understand and analyze.
- It can be used to identify trends, patterns, and outliers that are not visible in raw data.
With the help of data visualization software, businesses can make data-driven decisions quickly and efficiently, saving time and resources. It can also help them to communicate insights and findings more effectively to stakeholders, leading to better collaboration and alignment.
How we curated this list
We conducted extensive research to identify a wide range of software options within each category. This involved exploring online resources, industry publications, software directories, and user reviews. Please note that the pricing and features mentioned here are subject to change. We recommend you to visit the product website for the latest information before making a decision.

Product Description
ients, Canva makes it easy for users to create stunning visual content without any design skills required.
Pros and Cons
- Intuitive user interface that is easy to navigate, even for beginners.
- Wide selection of templates, graphics, and fonts to choose from.
- Can be used for a variety of design applications, from social media graphics to presentations and print materials.
- Limited customization options compared to more advanced design software.
- Difficulty in creating complex or intricate designs.
- Canva's free version has limited features, with more robust options requiring a paid subscription.

Product Description
Looker is a business intelligence software and big data analytics platform that helps you explore, analyze and share real-time business analytics easily.
Pros and Cons
- Looker can support multiple data sources and deployment methods, which means users have the power of choice and do not have to compromise on transparency, security, or privacy.
- Looker can enable teams to have access to consistent data for analyzing and reporting, which can drive better outcomes and help make effective, data-informed decisions.
- With Looker Blocks, embedded visualizations, and more, teams can quickly get started with pre-built blocks and dashboards to speed up custom work and get faster time-to-value.
- There is no mention of a free trial or any information about the cost of the product on the website for users who want to test it out before making a commitment.
- While Looker can unify and empower teams, it is not explicitly stated how it can handle collaboration and sharing of data and insights between team members who may have different levels of access.
- Looker's embedded analytics solutions, though versatile, may require users to have some technical expertise or knowledge of SQL dialects to make the most out of the product, which may be a barrier for some users.

Product Description
MongoDB Atlas Charts | MongoDB
Pros and Cons
- Charts is a native data visualization tool built for MongoDB Atlas that allows for quick and easy real-time business insights.
- Charts works directly with JSON data, reducing the time spent searching for insights and increasing the time spent making important business decisions.
- Embedded analytics in Atlas Charts allows for the quick and easy embedding of charts and dashboards into any application, providing powerful insights and relevant data to users where they need it.
- The availability of Charts is limited to those using MongoDB Atlas as their database platform.
- The pricing of Charts may be a drawback for some users, as it requires a paid Atlas subscription.
- While Charts allows for the creation of dynamic visualizations in just a few clicks, it may still require some technical knowledge to use and fully customize.

Product Description
AgencyAnalytics helps marketing agencies scale with automated client reporting. Create custom dashboards and reports for SEO, PPC, social media, and more.
Pros and Cons
- Automated reports and customizable dashboards save time and effort.
- Connects all clients' data under one roof with 75+ marketing integrations.
- 100% White labeled reporting strengthens the agency's brand.
- No information about pricing (except for a free trial).
- It may not be suitable for small agencies or businesses with a limited budget.
- Some users may prefer more specific details about the features and customization options offered.

Product Description
Create professional presentations, interactive infographics, beautiful design and engaging videos, all in one place. Start using Visme today.
Pros and Cons
- Offers a wide range of content types to create including presentations, documents, videos, and social media graphics.
- Provides a variety of features and assets such as icons, interactivity, photos, integrations, and flowcharts to enhance content.
- Enables collaboration and asset management for teams to work together efficiently and maintain brand consistency.
- Some advanced features may come at a cost as pricing plans have limitations for certain tools.
- The platform may take some time to learn for those without prior design experience.
- Limited language options available for non-English speakers.

Product Description
PopSQL is a unified SQL collaboration workspace that connects everyone in the data analysis process so you can obtain better insights by asking the right questions, together.
Pros and Cons
- Collaborative SQL editor allowing the team to work together on projects and organize queries.
- Shared connections feature makes it easy for team members to securely access the database without hunting for credentials.
- PopSQL tracks changes and provides version history, allowing the user to revert to any point in time in case of a mistake.
- Limited number of databases that can be connected to.
- There is no option for real-time data integration.
- The dashboard creation and visualization capabilities are limited compared to other tools in the market.
Product Description
Powerful call center analytics service for UC/CC systems. Easily analyze your customer engagement data and gain vital business insights.
Pros and Cons
- Allows users to gain strategic business insights by analyzing and visualizing customer engagements.
- Provides customizable dashboards and reports to fit the unique needs of call centers.
- Offers historical and real-time analytics to help improve employee productivity and customer satisfaction.
- Doesn't provide information about the cost or pricing plans for the product.
- No information about the features of other products from the same brand.
- It's unclear whether the product is suitable for small or large businesses.

Product Description
Together we empower children in Belize to receive a quality education, break free from poverty, and reach their God-given potential.
Pros and Cons
- Education is one of the best ways to help children in poverty, and sponsoring a student through PathLight provides them with tuition, uniforms, books, and more.
- PathLight selects students with the highest potential for academic success who can benefit the most from financial assistance.
- Donors have the option of becoming a PathMaker and fully sponsoring a student, or becoming a BridgeBuilder and contributing $34 per month towards a student's sponsorship.
- The cost of sponsoring a student may be too high for some donors who are unable to commit to a monthly or annual donation.
- PathLight only operates in Belize, so donors who prefer to support education initiatives in other countries may not be interested in this specific product.
- There is no guarantee that sponsoring a student will be successful in breaking the cycle of poverty, as there may be other social, economic, or political factors that impact their future success.

Product Description
Get software and technology solutions from SAP, the leader in business applications. Run simple with the best in cloud, analytics, mobile and IT solutions.
Pros and Cons
- Offers several solutions for different business needs and industries.
- Provides free trials for their software.
- Has a support portal and community for users to get help and engage with peers.
- Website errors may prevent users from accessing desired information.
- Lack of product descriptions in this particular passage.
- No indication of pricing or affordability of their solutions.

Product Description
Pros and Cons
- JMP offers a wide range of statistical analysis tools for researchers and data analysts.
- The software has a user-friendly interface, making it easy for users to navigate and analyze data.
- JMP provides interactive visualizations that can aid in the interpretation of data.
- The software can be expensive for individuals or small organizations.
- Some users may find JMP to be less flexible than other statistical analysis software.
- It may take some time to get the hang of all of JMP's features and functionalities.
Product Description
Infogram is an easy to use infographic and chart maker. Create and share beautiful infographics, online reports, and interactive maps. Make your own here.
Pros and Cons
- Infogram offers a wide variety of content creation options, including infographics, reports, slides, dashboards, posters, social media posts, and more.
- The tool offers a vast collection of designer templates that can help users save time and create beautiful content with ease.
- Infogram allows real-time collaboration, which makes it easy for teams to work together on visual projects.
- Infogram's pricing plans might be a bit expensive for smaller businesses or individuals who only need to create infographics occasionally.
- Some users might find the tool overwhelming due to the numerous features and options available, which might make it difficult to navigate.
- While Infogram offers powerful analytics, some users might find the customization options for tracking links limited.
Product Description
As the international honor society of nurses, we develop nurse leaders in the nursing profession by providing recognition, education, and global opportunities. Together, our dedicated members, from all different walks of life, from all over the world, change lives and advance healthcare.
Pros and Cons
- Provides news and information related to nursing, healthcare, and policy.
- Offers resources such as free webinars, podcasts, and microlearning videos for nurses.
- Provides membership benefits such as discounts on Sigma merchandise and education.
- The website is poorly organized, making it difficult to find specific information.
- The website seems to be geared more towards Sigma members and may not be as useful for non-members.
- The website does not have a clear focus or purpose and includes a variety of information not necessarily related to nursing or healthcare.
Product Description
Business intelligence software that frees the insights you desperately need to fuel growth and transform your business.
Pros and Cons
- Connect, store, and blend data from hundreds of data sources.
- Inline ETL transforms and point-and-click tools for data preparation without complex SQL queries.
- Powerful data visualization and KPI metrics tool.
- May have limited compatibility with certain data sources.
- Some features may require technical expertise for proper utilization.
- May not be cost-effective for smaller businesses with limited data needs.

2.8
Product Description
Forsta's HX Platform seamlessly integrates CX and Employee Experience (EX) data to provide a comprehensive view of all interactions and behaviors that impact human experiences.
Pros and Cons
- Forsta offers advanced survey tools that allow businesses to gather valuable insights and feedback from customers.
- It offers a customizable and user-friendly interface that makes it easy for businesses to create and manage surveys.
- The platform provides real-time reporting and analytics, allowing businesses to quickly and easily analyze survey data.
- Forsta's pricing plans can be expensive for small businesses and startups.
- It may require some technical expertise to set up and customize certain survey features.
- Forsta's data visualization options could be improved to better showcase survey results.
Product Description
A beautiful selection of local artists and artisans. Your one-stop shop for art, flora, furniture and thoughtful gifts. Three locations across San Diego: North Park, Liberty Station in Point Loma, and Del Mar.
Pros and Cons
- Offers a variety of products ranging from plants and home decor to jewelry and clothing.
- Has a section for gifts, including gift cards and gift wrap options.
- Offers workshops and events for customers to participate in.
- No information provided on the quality or origin of the products.
- No prices listed in the initial product preview, so customers have to click through to see the price.
- No reviews or customer feedback provided on the website.


Frequently asked
questions
The best data visualization software depends on your specific needs and goals. Popular options include Tableau, Power BI, and Google Data Studio. Evaluate features, pricing, ease of use, and integration capabilities to find the software that aligns with your business requirements.
Data visualization software offers benefits such as improved data comprehension, faster decision-making, identification of trends and patterns, effective communication of insights, and increased collaboration. It helps businesses gain a competitive edge, optimize operations, and drive growth by making data actionable.
The common use of data visualization software is to present complex data and information in an easily understandable and visual format. It enables businesses to make informed decisions based on insights, track performance, identify trends and patterns, and communicate effectively with stakeholders. It also provides features for customization, real-time data tracking, and collaborative editing to enhance data analysis.
Consider features like data import/export capabilities, customizable visualization options, interactivity, real-time data updates, integrations with data sources, user-friendly interface, data security, automation, collaboration tools, and customer support when choosing data visualization software. These features can help you efficiently represent and interpret your data for effective decision-making.
Data visualization software is used across various industries, including finance, marketing, healthcare, government, technology, and more. It is a powerful tool that helps businesses to effectively present and analyze complex data through visual representations.
The cost of data visualization software varies based on features, provider, and level of service required. It can range from free plans with limited features to monthly subscriptions starting at $10 to $500 or more, depending on the scale and level of service required.
Yes, there are free data visualization software tools available. Some popular options include Tableau Public, Google Data Studio, and RawGraphs. These free plans often have limitations on features, data sources, and file types. However, they can be a good starting point for small businesses or those with basic data visualization needs.
Data visualization software typically requires a higher level of technical expertise than email marketing tools. It involves working with data sets, creating visualizations, and analyzing results. Basic computer skills may be enough for simple tasks, but more advanced features and complex data analysis will require technical knowledge and expertise. Support resources may be available for assistance.
How to use this page to find the right software
Identify your needs and requirements from the software. Consider factors like functionality, features, platform compatibility, budget, and any specific industry or personal preferences.
Based on your needs, prioritize the features or functionalities that are essential for your software.
Explore the website link of each software to gather more detailed information about it.
Still not sure?
Discuss you software needs in our community of experts. Join Marketing Tribe ->
What’s next?
Learn more hacks and tricks of growing your business. Subscribe to daily dose of marketing and growth tactics and lessons. Subscribe to the Mailmodo Bulletin ->
Similar Categories
Early stage startup? These tools might help you


Get 3X email conversion
with Mailmodo

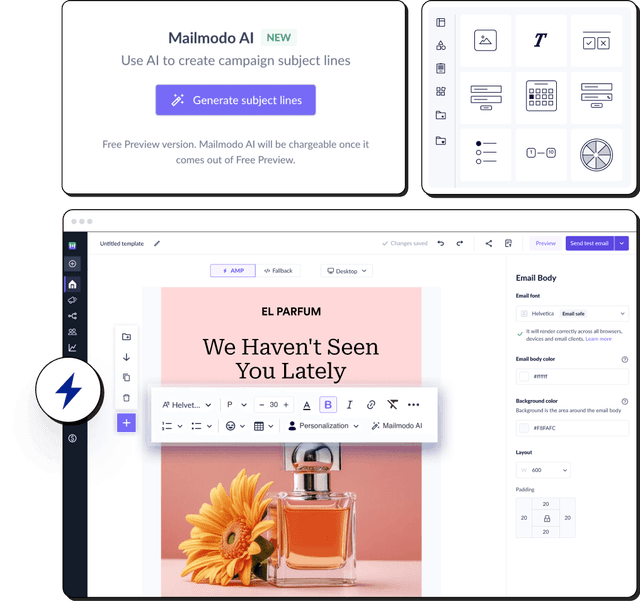
Create & send interactive emails without coding
Put revenue on auto-pilot with pre-built journeys
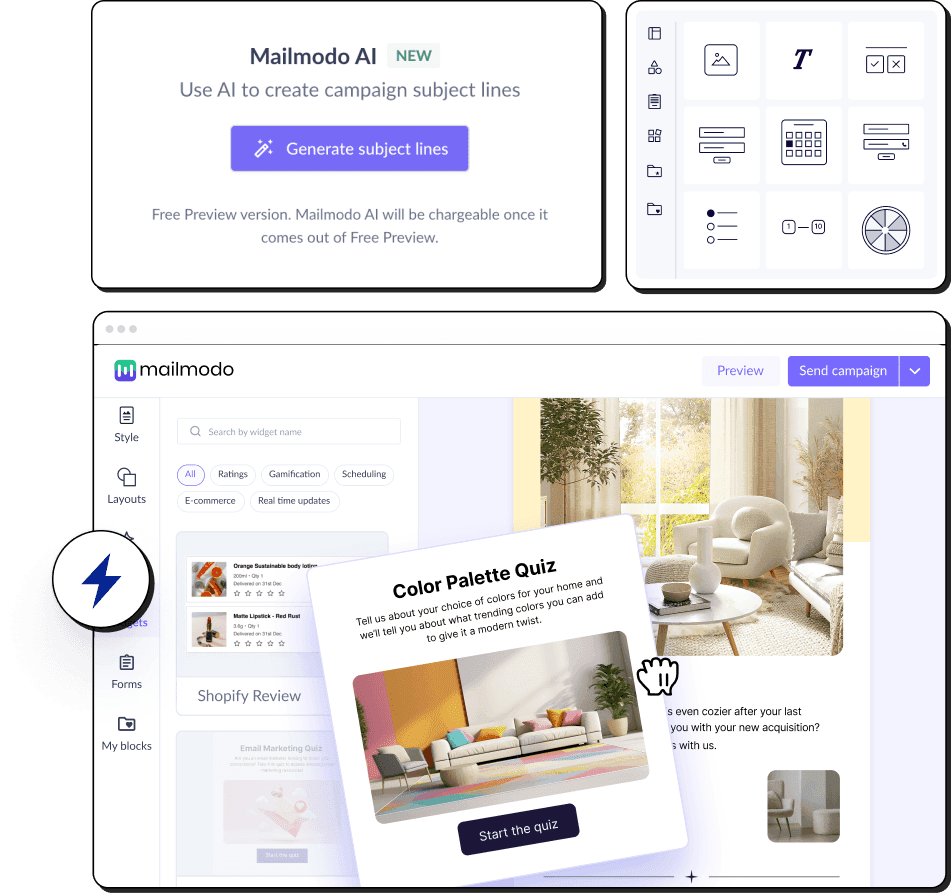
Save time with AI-powered email content creation
Experience world’s only interactive email marketing platform
Trusted by 10000+ brands